
Linux’s time command and Python’s timeit modules are two of the
most handy tools when profiling a program. For example I always
wanted to know which one of these two methods for getting the current
Unix epoch in Python is
faster: time.time() or datetime.datetime.now().timestamp()
since they seem to produce the same result:
#!/usr/bin/env python3
import time
import datetime
from timeit import timeit

print(timeit('time.time()', globals=globals()))
print(timeit('datetime.datetime.now().timestamp()', globals=globals()))
From the result, it’s clear that time module is several times faster.
There I have it, debate solved as to which module to use.
But as to why, this profiling tool leaves us no clue.
Maybe the underlying system call is faster or maybe it’s the Python
execution portion which is faster than that of the datetime module.
While these simple tools are cute and useful for simple program execution profiling, but in complex programs we need more powerful tools. Specifically we need a tool that can break down the entire flow of the program into smaller execution units (be it function, lines, etc.) and trace and measure the execution time per each unit.
Python offers a builtin module and several external libraries to make it possible to create a detailed execution profile of a program. This is a recap of my experience profiling a fairly big Python program to find it’s choke points and concentrate on optimizing them.
Python’s profile module can easily create a file containing the execution
profile of a program. You don’t even have to write code for it:
python -m profile -o <filename.pstats> "program.py"
The profile module, like some other Python builtin modules, comes in two
variants: A pure Python but slow version profile and a compatible but
much faster reimplementation of that module in C called cProfile.
In the command above, these two modules are interchangeable. But even the
resulting slowdown of profile is negligible compared to the whole
program because Python programs are generally executed inside an interpreter
which is already a very slow method.
After the program is finished executing, this module leaves a binary file
which includes the actual data gathered during execution profiling. Python
comes with another builtin module, pstats, which can parse this file,
sort the statistics according to a given criteria and print readable
reports from it. Note that Python makes no promises to keep profiling data
format compatible across Python versions or different operating systems,
so we have to use the pstats module from same interpreter that provided
the profile or cProfile module. The actual file format is
marshaled version of an undocumented internal Python data structure.
To use this module, we have to write a small Python script (or use the interactive shell, or a Jupyter notebook, or whatever):
#!/usr/bin/env python
import sys
import pstats
from pstats import SortKey

def main():
    try:
        filenames = sys.argv[1:]
    except IndexError:
        print(f"Usage: {sys.argv[0]} <filename> ...")
        sys.exit(1)

    # combine stat files into an aggregated pstats instance
    p = pstats.Stats(*filenames)
    # remove path prefixes
    p.strip_dirs()

    # print all stats
    p.sort_stats(SortKey.STDNAME).print_stats()

    # filter criteria.
    # can be used to limit the result set and filter out modules by name.
    restrictions = (100,)

    # print top n stats sorted by module name
    p.sort_stats(SortKey.NAME, SortKey.FILENAME).print_stats(*restrictions)

    # print top n stats sorted by module name, file name and line number
    p.sort_stats(SortKey.NFL).print_stats(*restrictions)

    # print top n line number stats sorted by module name
    p.sort_stats(SortKey.LINE, SortKey.FILENAME).print_stats(*restrictions)

    # print top n number by number of calls
    p.sort_stats(SortKey.CALLS).print_stats(*restrictions)

    # print top n number by cumulative time
    p.sort_stats(SortKey.CUMULATIVE).print_stats(*restrictions)

    # print top n number of functions by time
    p.sort_stats(SortKey.TIME).print_stats(*restrictions)

    # print top n number of functions that called each function in the
    # profiled database
    p.sort_stats(SortKey.CALLS).print_callers(*restrictions)

    # print top n number of functions that were called by the indicated
    # function
    p.sort_stats(SortKey.CALLS).print_callees(*restrictions)

if __name__ == '__main__':
    main()
Below is a context manager that starts and stops profiling when entering and exiting a specific block of code:
import cProfile
import io
import pstats
import contextlib

@contextlib.contextmanager
def profiled(**kwargs):
    restrictions = kwargs.get('restrictions', (100,))
    pr = cProfile.Profile()
    pr.enable()
    yield
    pr.disable()
    s = io.StringIO()
    ps = pstats.Stats(pr, stream=s).sort_stats(SortKey.CUMULATIVE)
    ps.print_stats(*restrictions)
    ps.print_callers(*restrictions)
    print(s.getvalue())
Can be used like this:
with profiled():
    run_block_of_suspect_code()
Beware that if you intend to profile a multiprocess program, you can’t
rely on the command above to create the profile stats file, because it
does not track child processes that are spawned from the main process.
Those probably are worker processes and are the most interesting parts
of the program to monitor. In these programs that use multiprocessing
module, you have to fiddle with the code of the program a bit.
If the process entry point is a simple function:
import multiprocessing
import profile
import os

def worker():
    pass

p = multiprocessing.Process(target=worker)
p.start()
You need to wrap the worker function in another function which runs it under the supervision of the profiler:
def profile_worker():
    profile.runctx('worker()', globals(), locals(), filename=f'worker_{os.getpid()}.pstats')

p = multiprocessing.Process(target=profile_worker)
p.start()
# possibly more instances
p.join()
But if you have sub-classed multiprocessing.Process class and overridden
run() method or if the processes run perpetually and don’t give a chance
to profile module to write the dump file when they return, things become
a bit more involved. You have to manually enable profiling at the start
of the process, install a signal handler, catch the stop signal, stop
the profiler and dump the gathered stats in a file before exiting the program:
import signal
import os

class InterruptSignal(Exception):
    pass

def raise_interrupt_signal():
    raise InterruptSignal()

signal(SIGINT, raise_interrupt_signal)

class ProfiledProcess(multiprocessing.Process):
    """A Process sublcass that enables profiling of the running code"""
    def run(self):
        profile.enable()
        try:
            # make sure there is no catch-all exception handler inside
            self.start_entry_point()
        except InterruptSignal:
            profile.disable()
            profile.dump_stats(f'{self.name}_{os.getpid()}.pstats')

    def start_entry_point():
        pass  # override

p = ProfiledProcess()
p.start()
# possibly more instances
p.join()
Don’t forget to kill the program with SIGINT (the default for kill command)
to have the program create the profiling file. Child processes inherit
signal handlers from the parent, so this will work for all subprocesses.
pstats module can accumulate several profile data dumps into a single
report, which is nice in my case where several instances of the same
process were instantiated, and were running the same code.
pstats does a fine job of creating reports from profile dumps, including
caller and callee reports, but gprof2dot
project can visualize the call graph into graphviz dot files which
can then be converted into beautiful graphs.
Graphviz can be installed from Linux
package repositories and gprof2dot from PyPI:
apt-get install graphviz
pip install gprof2dot
Although this is a Python script, it supports several profiling data formats,
related to different programming languages and environments in addition
to Python’s profile module format. So to create a call graph from our
generated profile files and convert it to an image file:
gprof2dot -f pstats -o callgraph.dot <filename.pstats>
dot -Tpng -o callgraph.png callgraph.dot
There are also GUI interfaces for analyzing profiling information more interactively. RunSnakeRun, SnakeViz and KCacheGrind are such programs.
RunSnakeRun is present in Linux package repositories, but it did not work for me since the stock version is quite old. I tried to install it right from the PyPI in a virtualenv built using the same Python interpreter as for the actual program. GTK+ and wxWidgets library development packages are prerequisites for building the package dependencies and must be installed beforehand. But after all was done and the program installed, I got a different error message after running it and gave up on it since this project looks unmaintained.
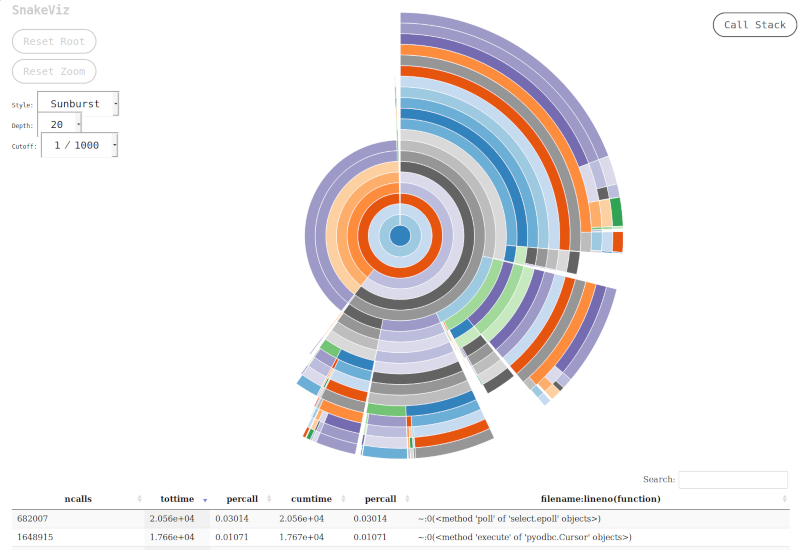
SnakeViz is a web based
reporting tool for Python profile module data dumps. It can
be found on PyPI and compared to the RunSnakeRun it installs
and runs in a breeze. The interface and reporting output are quite
intuitive and interactive. This program works by serving the
profiling data via an API using Tornado and uses D3 library in the
browser for visualization.
pip install snakeviz
snakeviz <filename.pstats>
SnakeViz automatically opens a browser window running the client code
and points it to 127.0.0.1:8080 where the server is run. Command line
parameters exist to customize this behaviour. The only pitfall with
SnakeViz is that currently it can only process files dumped using
cProfile module and profile module is not supported.
Unlike pstats module this program cannot process several
profiling data files in one run. Nothing that cannot be fixed, because
pstats module can dump its internal aggregated database into a new file:
import pstats
import glob
p = pstats.Stats(*glob.glob('*.pstats'))
p.dump_stats('aggregated.pstats')
And then:
snakeviz aggregated.pstats
KCacheGrind is another execution profile visualizer.
To use KCacheGrind, Python profile files must first be converted to
a different format because this tool is mainly developed for Valgrind
program profiles. We need to convert the profile data dump into calltree
format, which is the supported data format of KCacheGrind.
pyprof2calltree is what we need:
pip install pyrpof2calltree
pyprof2calltree -i <profile.pstats> -k
The latter command converts the Python profile output to calltree format
and automatically opens KCacheGrind on the resulting file. KCacheGrind
is a comprehensive program to analyze profiling information. Let’s just hope
the Python profile converter becomes one of the profiling file format
converters which are shipped with it by default someday.
Among third-party Python code profilers
line_profiler is quite popular.
As you might have noticed, Python’s builtin profile module is focused
on functions (and methods) and measures execution time at function boundaries.
But line_profiler, as the name gives away, does it at line level.
This level of detail gives insight on the performance of single program
instructions, which would otherwise be lost. The catch is line_profiler
makes code execution time orders of magnitude slower compared to profile.
vprof is an independent Python code profiler which combines time and memory profiling on functions with a GUI to analyze the results. It has a command line interface for profiling the code and a web interface for reporting the results. Install from PyPI:
pip install vprof
It is also possible to profile memory usage and allocations of a Python program
using the builtin tracemalloc module.
As with time profilers, there are also external libraries which provide
different sets of features for memory profiling.
meliae is such an example.
I will write more about memory profiling when I have to debug a program
that eats memory like crazy.